There have been plenty of headlines this year about how healthcare costs are going up due to multiple reasons: legislative and executive actions, rising health insurance premiums, increase in prescription drug prices – the list goes on. Recently, top executives of seven pharmaceutical companies testified before Congress about rising healthcare costs. Healthcare is a fiercely debated issue in the US, and like many other hot-button issues is a polarizing one, with many arguing for the need for major reform, but few agreeing on what the measures should be. Here, we will take a look at how healthcare costs have changed for the average American family over the past couple of decades.
Milliman Medical Index and change over the years
The latest Milliman Medical Index (MMI) was released in May 2018. MMI measures the cost of healthcare for a typical American family of four receiving coverage from an employer-sponsored preferred provider plan (PPO). After last year’s MMI report came out, I took a (somewhat) deep dive into data from the previous years and analyzed trends from 2001 (the first year for which MMI data were available) through 2018.
According to the report, for the typical American family of four, total healthcare costs stood at $28,166. These are staggering numbers, considering the median household income for a family of four was only $61,372 in 2017 and the Federal Poverty Line was $25,100 in 2018 (latest years for which these values were available). For comparison, the average net price for tuition, fees, and room and board for private college during the 2017-2018 school year (after discounts like financial aid and grants) was $27,160 (Figure 1).
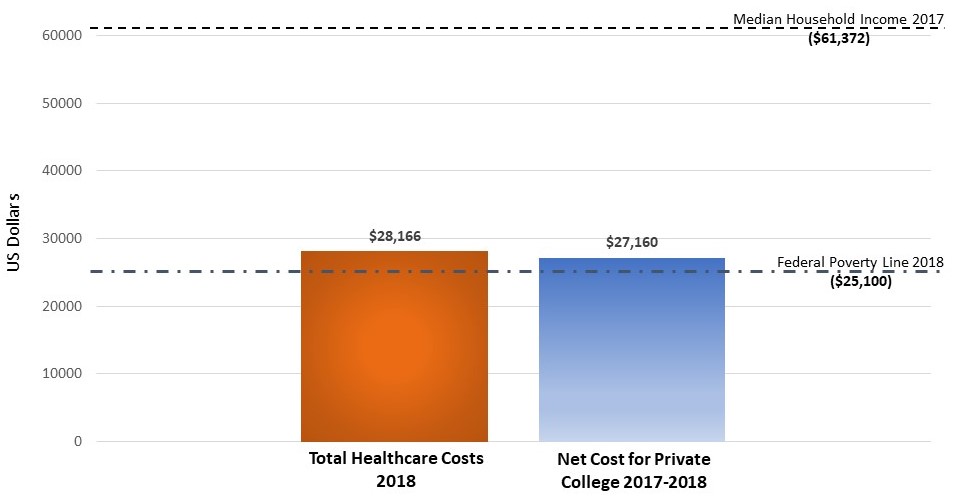
less than healthcare costs for the year 2018
Compared to healthcare costs for 2017, this is an increase of 4.5%, similar to last year’s increase of 4.3% (which, incidentally was the lowest increase in the 18-year history of MMI). While we may be tempted to breathe a sigh of relief at the recent deceleration in healthcare cost increases, it will be worthwhile to keep in mind that total healthcare costs ballooned from $8414 in 2001 to $28,166 in 2018 – roughly a 3.4-fold increase – and costs have been increasing at the rate of roughly $100/month. At this pace, total costs are set to hit $30,000 by 2020 and $35,000 by 2024 (Figure 2). Consider a car speeding through the neighborhood at 60 mph. After a few minutes, it accelerates to 70 mph, and a few more minutes later, to 75 mph. Should we rejoice at the car reducing its acceleration – after all, first it sped from 60 mph to 70 mph, but then it only went from 70 mph to 75 mph – or be concerned that the car is now cruising at an even higher speed than it was initially?
To project healthcare costs for the years up to 2024, I used a linear regression model to extrapolate these numbers based on existing data. As you can see, a coefficient of determination (R2) >0.99 for the lines shows that it fits well. R2 is a statistical measure of how close the data are to the fitted regression line. R2 values range from 0 to 1, with 1 representing a perfect fit between the data points and the regression line, and 0 meaning there is no statistical correlation between the data and the line. The closer R2 is to 1, the better the fit of the regression model.

Figure 2. Healthcare costs have been rising steadily for the last two decades
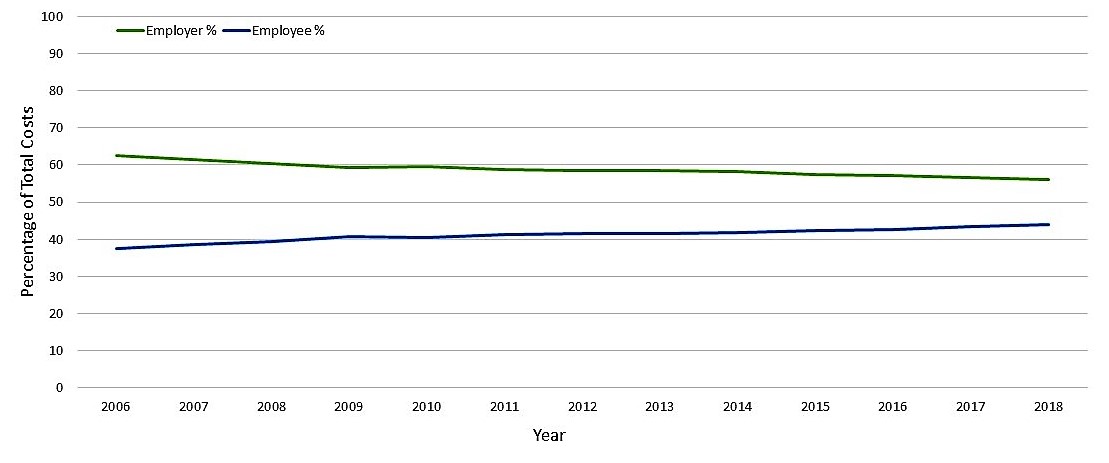
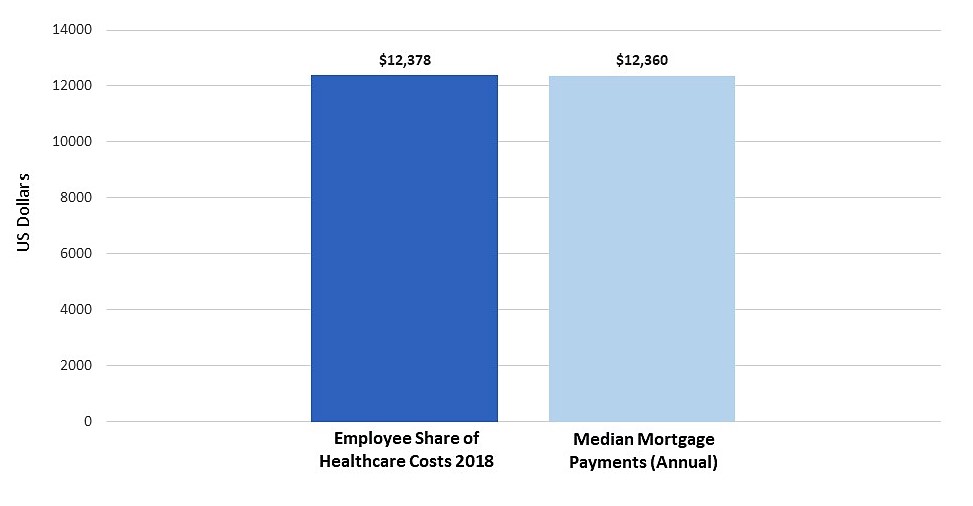
Total healthcare costs for this family can be divided into two: Amount paid by the employer for the insurance plan (Employer costs) and the amount paid by the employee as payroll deductions for the insurance plan as well as the out-of-pocket costs (Employee costs). While both costs have been increasing steadily since the inception of MMI (Figure 2), employees are covering a bigger portion of these rising costs than they have in the past. Since the MMI was first published in 2005, the percentage contribution of employees to total cost has gone up every year, except for 2005-2006 (Figure 3A). Thus, the gap between employer and employee contributions continues to narrow as more of the rising expenditure is transferred to the employee. Employee costs (payroll deductions + out-of-pocket costs) for 2018 was $12,378 while employer costs stood at $15,788. Based on the current trend, these numbers are set to reach $15,000 and $20,000 respectively, by 2024. This also means that the family may have spent roughly the same amount on healthcare as they did on their mortgage, considering the median mortgage payment in the US was $12,360 (Figure 3B).
[/one-half-first][one-half]
 [/one-half]
Where the money went
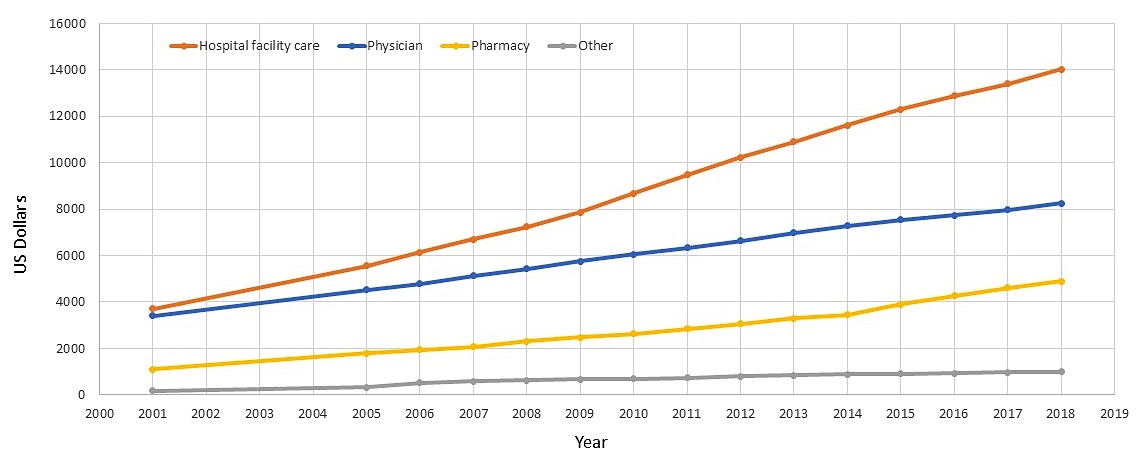
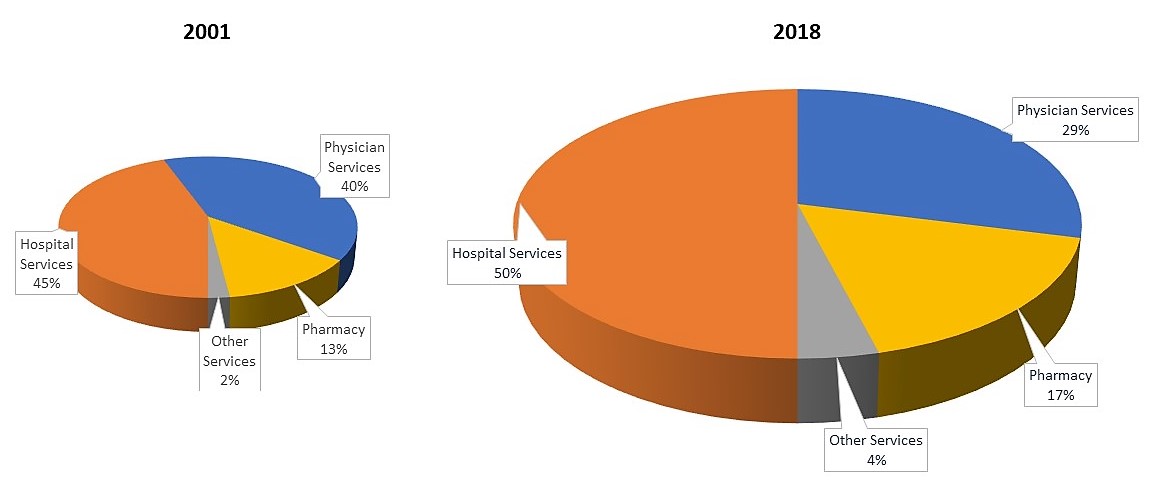
It is also worthwhile to look at how cost of healthcare has grown by individual components. MMI lists five separate categories of healthcare services, namely: inpatient facility care, outpatient facility care, professional or physician services, pharmacy, and other services. You can see that hospital facility care (inpatient + outpatient) costs have increased at a much higher pace compared to other services. For instance, in 2001, hospital facility care and physician services cost similar amounts ($3711 and $3407, respectively), but by 2018, the former was 1.7 times as expensive as the latter (Figure 4A). While the overall pie has grown bigger, the share of physician services has grown smaller with mainly hospital facility costs and pharmacy costs eating into it (Figure 4B).
It is interesting to note that in usual discussions about ills plaguing healthcare, pharmacy costs often get the Big Bad rap, but hospital services seem to be equally, if not more, responsible for the ballooning costs (However, these high prices for care do not necessarily translate to huge profits, as according to American Hospital Association, the hospitals’ overall operating margins for 2016 was 7.7%. This can mostly be attributed to gross inefficiencies of our healthcare system, but that is the topic for another day).
 [/one-half-first]
[one-half]
 [/one-half]
Figure 4. (A) Hospital facility care costs have increased at a higher pace compared to other components (B) While the overall pie has grown bigger, the share of physician services has grown smaller with mainly hospital facility costs and pharmacy costs eating into it
In a nutshell
Healthcare costs for the typical American family receiving coverage from a PPO have been increasing at a pace of $100/month in the 21st century. While the rate of increase has declined in the past few years, it may not necessarily be cause for celebration. As overall healthcare costs have been on the rise at a faster pace than inflation, some of the individual components have seen even more dramatic increases. Recent trends show that much of this burden will be passed on to the employees as companies try to reduce their own rising costs.

Hi there! I’m Aaram, the founder of Sciencera. I grew up in the beautiful city of Thiruvananthapuram in the Southern part of India, famous for its pristine beaches. Now, I am a scientific writer based in Indianapolis. When I am not busy procrastinating on my writing, poring through research articles, or coming up with grand ideas to save the planet, I love playing soccer and chess. I read a bit and write sporadically when caffeinated to the right amount. I am passionate about scientific research, writing, and outreach activities.
